By logging in, you agree to our terms of service and privacy policy
Start Creating
Data For AI


Want to talk to our sales team instead?
By logging in, you agree to our terms of service and privacy policy
DATA… OUR MOST CRITICAL RESOURCE

 Alex Feliciano
![]() Sep 1, 2023
Sep 1, 2023
What resource unites innovations such as self-driving cars, package delivery drones, and ChatGPT? You might assume that it’s cutting-edge AI models, exceptional teams of engineers and technicians, or even state-of-the-art hardware. And while these are certainly important, nothing within the realm of ‘digital transformation’ would be possible without something even more foundational: usable data.
Abhishek Mehta, Tresata’s CEO & co-founder, was the first to go on record in 2010 in identifying data as ‘the new oil’ to propel the next Industrial Revolution. This assertion is something that has become ubiquitous today, particularly for those of us seated on the frontlines (aka those doing data engineering work) and tasked with getting data ‘ready’ for both individuals and systems.
From creating trusted digital identities to IoT to generative AI, all of these digital technologies are underpinned by the processing, analysis, and manipulation of basic bits and bytes. In an ideal world, it would be just a matter of finding your data to harvest its value. However, akin to the way crude oil necessitated refinement before fueling the 19th-century industrial revolution, data similarly requires deliberate and systematic purification to get it ready for use in any of these digital technologies.
Not to mention that the digital world is continuing to generate more and more data.
In a recent report produced by Accenture, they shared that “an estimated 64.2 zettabytes of data were created in 2020 alone— and by 2035, it is predicted that 2,142 zettabytes of data will be created each year.” To put that into perspective, a zettabyte is equal to a thousand exabytes…a billion terabytes…or a trillion gigabytes. Simply put, it would mean one billion, one terabyte hard drives (the maximum base storage for a 2023 Macbook Pro) would be needed to store one zettabyte of data.
So, if you’re one of those, like me, doing the heavy lifting described above, you may be wondering: how can you curate such vast amounts of information into usable data products, let alone a zettabyte without pulling your hair out in the process?
As fellow data engineers, we’ve faced the same trials and tribulations that line the path to creating usable data, data products, data assets, or whatever you prefer to call them. Having undertaken this process both manually and with AI-powered software – we’re here to show you (not just talk about) an easier way. One that was made for people like you, by people like you.
Before delving into how we’ve streamlined this process, let’s lay out the steps involved:
- Source – data extraction, collection, ingestion, and/ or transfer to the appropriate environment/ storage location
- Profile – data quality analysis, classification, discovery, metadata capture, and reporting to understand what you have
- Prepare – data standardization, cleansing, denormalization, and the common ELT functions needed to stage the data for processing
- Connect – the process of integrating the data via clustering and linking the records to stitch together the disparate data sources into a unified single source of truth
- Validate – quality assurance (QA), measurement, and verification of the output you’ve just produced to iterate and refine the results (arguably the most important element of this process)
- Enrich – leveling up your data by generating golden/ curated information to enrich each record (i.e identifying the best name, address, identifiers to enhance data quality and align schemas)
- Orchestrate – automation of all the steps above so that when you’ve built it once, you can run it infinitely in a coordinated manner AND modify it as needed without breaking the entire flow
While the terms used to describe these steps might differ from person to person, the fundamental process and functions are in line with industry standards.
Now that we’ve aligned on what each step entails, we will go through how Tresata’s software (powered by AI) optimizes these steps from a backend/engineer’s perspective, boosting Data Engineer intelligence, productivity, efficiency, and effectiveness.
Step 1 – Source your Data
When it comes to sourcing your data for downstream analytics or as input into an AI model, it’s more than likely your data exists across multiple systems (often tens, if not hundreds or more). From past experiences, this can be a very tedious process to identify all the source systems you need to pull data from, confirm the tables/ schemas, determine the formats (i.e. ODBC/JDBC, Parquet, JSON, CSV, etc.), configure the connection details, and finally establish a pipeline to extract the data. To lighten this load (pun intended), we’ve streamlined this process by building connectors that support all industry standard formats and source systems. For our software, performing the classic ELT activities can effectively be done in one-line by simply specifying the format and location and any additional options you might desire.
For example, let’s say we want to build a data product to analyze customer purchasing patterns at your business.
To keep things simple, let’s say the data exists in 3 different systems:
1 delta table in a Delta Lakehouse in Azure containing transactions,
1 customer reference table sitting inside a Microsoft SQL server, and
1 externally sourced customer demographics table sitting inside OpenSearch.
With our software, the commands would look this:
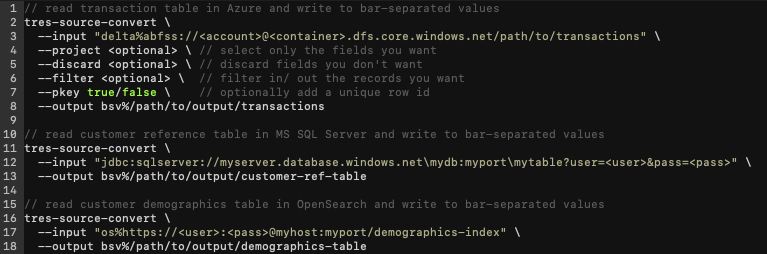
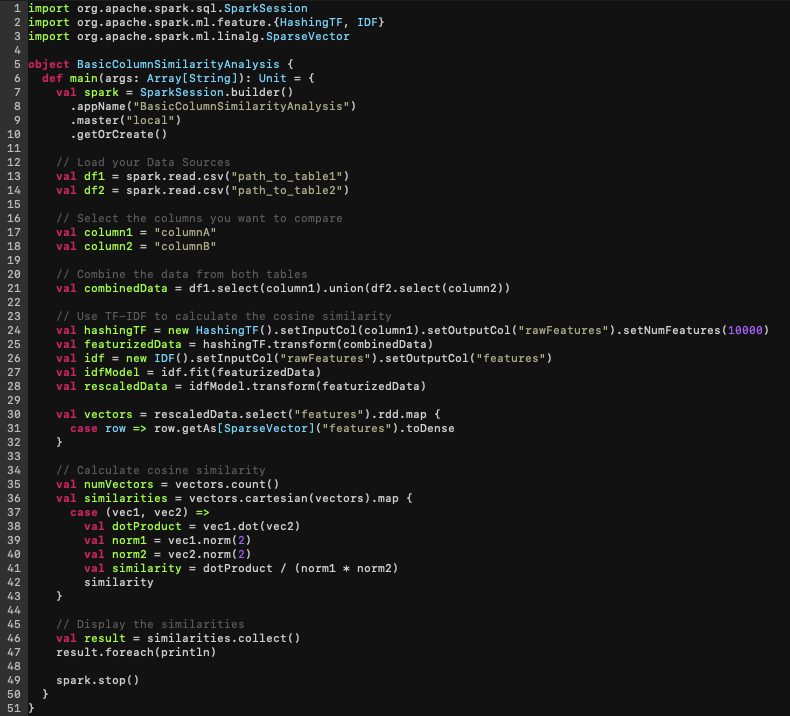
If this were written now in Apache Spark/ Scala (as shown below), there’d be almost 3x as many lines of code. Not to mention, interpreting what’s happening is more difficult to understand and prone to variance between DEs.
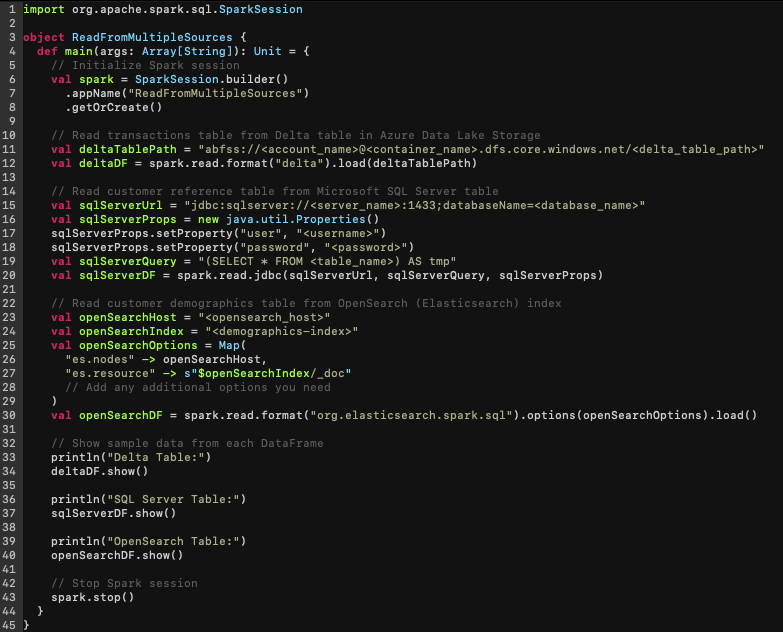
As evident, a considerable level of complexity is being handled by Tresata software, which would otherwise necessitate a more concerted effort to code and implement on its own. It is through sophistication of the AI baked into each step that we are able to achieve this simplicity.
Step 2 – Profile your Data
After acquiring the data, the next step involves profiling your tables to gain a clearer insight into their content. Numerous Data Quality analysis tools can provide basic statistics such as record count, population percentage, cardinality, and mask analysis, shedding light on the data’s size and structure. This gets you most of the way, but requires still integrating specialized tools into your ecosystem, often resulting in unnecessary redundancy and cruft. This redundancy can also lead to inconsistent outcomes and confusion about the source of truth (given each one will report things slightly different).
While these tools are a good starting point, the true challenge lies in moving beyond standard reporting and delving deeper into metadata analysis and genuine data discovery.
For example, you might want to identify similar tables/columns without manually reviewing each one for overlaps (especially since you’ll likely have hundreds, if not thousands). Furthermore, you need to be able to automatically infer the relationships between these columns and subsequently propagate their similarity across your data sources (think of it as metadata relationship discovery). You’ll then want to apply a tag or label to these fields so you can easily retrieve them for future use. These tagged fields become your Critical Data Elements (CDEs, or what we call ‘canonical fields’) that represent your core information. In the context of building a data product, this step is vital, especially for upcoming data integration tasks.
Generating these insights on the same 3 tables we just ingested using Tresata software would require only 4 simple commands, as depicted:
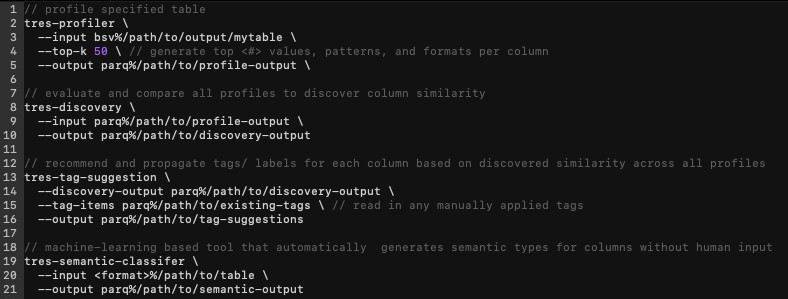
- tres-profiler – generates all common quality statistics for every table/ column (population, mask analysis, cardinality, top values, formats, etc.)
- tres-discovery – evaluates and compares similarity based on field content for every column across every profiled table
- tres-tag-suggestion – recommends and propagates a label or tag for each column based on field similarity from the discovery output i.e. field A and B look like a Tax ID
- tres-semantic-classifier (bonus) – machine learning based tool for automatically inferring and classifying semantic types such as PII
If approached through traditional methods, the flow looks more like this:
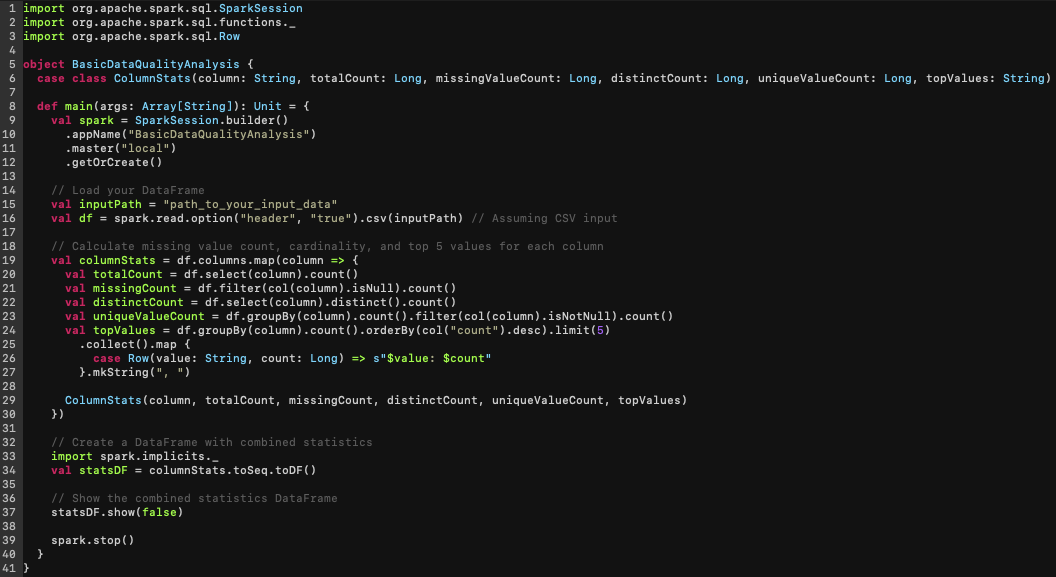
The above script carries out elementary statistical calculations such as population assessment, cardinality measurement, and identification of the top 5 values within each column. These actions represent only a segment of the complete scenario. Further, should you attempt to reproduce a similar process for column discovery involving just two columns and tables, the effort might resemble something along the lines of this:
Once again, the analysis quickly becomes cumbersome and is constrained to simplistic methods (and this is just for two columns and tables!). Just imagine attempting this across every single table and column, and you’ll grasp how this could quickly turn into a daunting and computationally infeasible task.
Step 3 – Prepare your Data
The data preparation phase can introduce heightened complexity. The effectiveness of your preparation relies heavily on the depth of your exploration and understanding of the recently profiled data. In practical terms, all the anomalies, issues, deviations, and other insights garnered through a comprehensive analysis of the underlying data in your tables should shape the necessary prep activities in your data engineering process. As you can imagine, entering this stage with limited information on your data places you at a disadvantage.
The task of codifying every routine, tailored to individual columns and tables, consistently proves arduous and error-prone due to its manual nature and susceptibility to variability depending on who’s doing the work. This variability is based on an individual’s unique experiences and cognitive processes when wrangling data which can make this process even more challenging. This is where templatized cleansing and standardization techniques can truly make a transformative impact on an engineer’s efficacy and productivity.
To illustrate this point, let’s take a simple example around standardizing a table’s source country field to ISO-3. Let’s imagine we want to standardize this list of values to ISO-3 country codes like “usa”:
- • Seq(“US”, “United States”, “United States of America”, “USA”, “united states”, “U.S.A”)
To streamline this operation, we’ve developed a dynamic domain specific language (DSL) called the “canonical configuration” that leverages the labels (canonicals) produced from the profile step. It can be configured using YAML and allows the user to easily align the fields and appropriate standardizations without writing a single line of code.
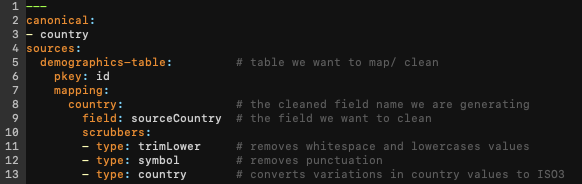
As you can see between lines 10-13 above, we have pre-trained data scrubbers available that are designed to standardize variations in underlying values and consistently convert them to the intended target state.
Now if we were to write Spark code to achieve the same thing, it would look something like this:
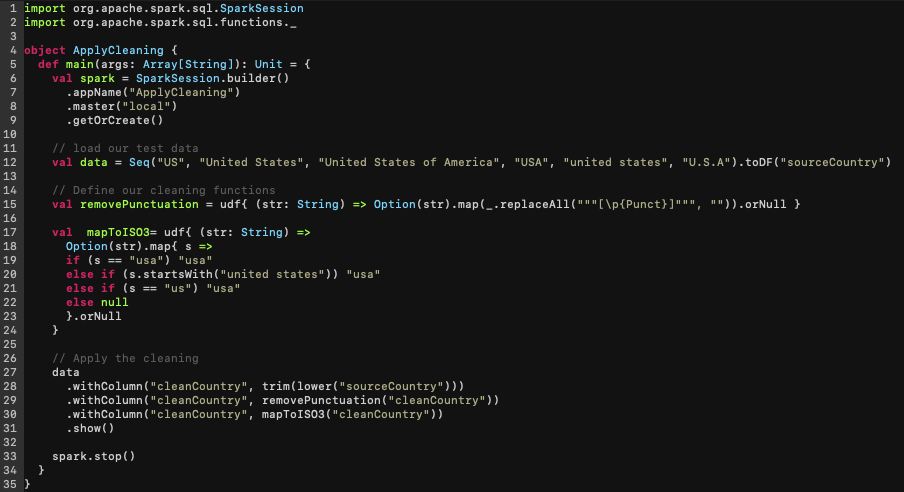
In our example, for just 6 values, you can see this required defining a number of functions to account for variance in casing, spelling, nulls, and punctuation. Imagine doing this for all of your columns and tables on top of having to figure out all of the edge cases… it’s apparent why this activity can easily consume the bulk of a Data Engineer’s time!
Step 4 – Connect your Data
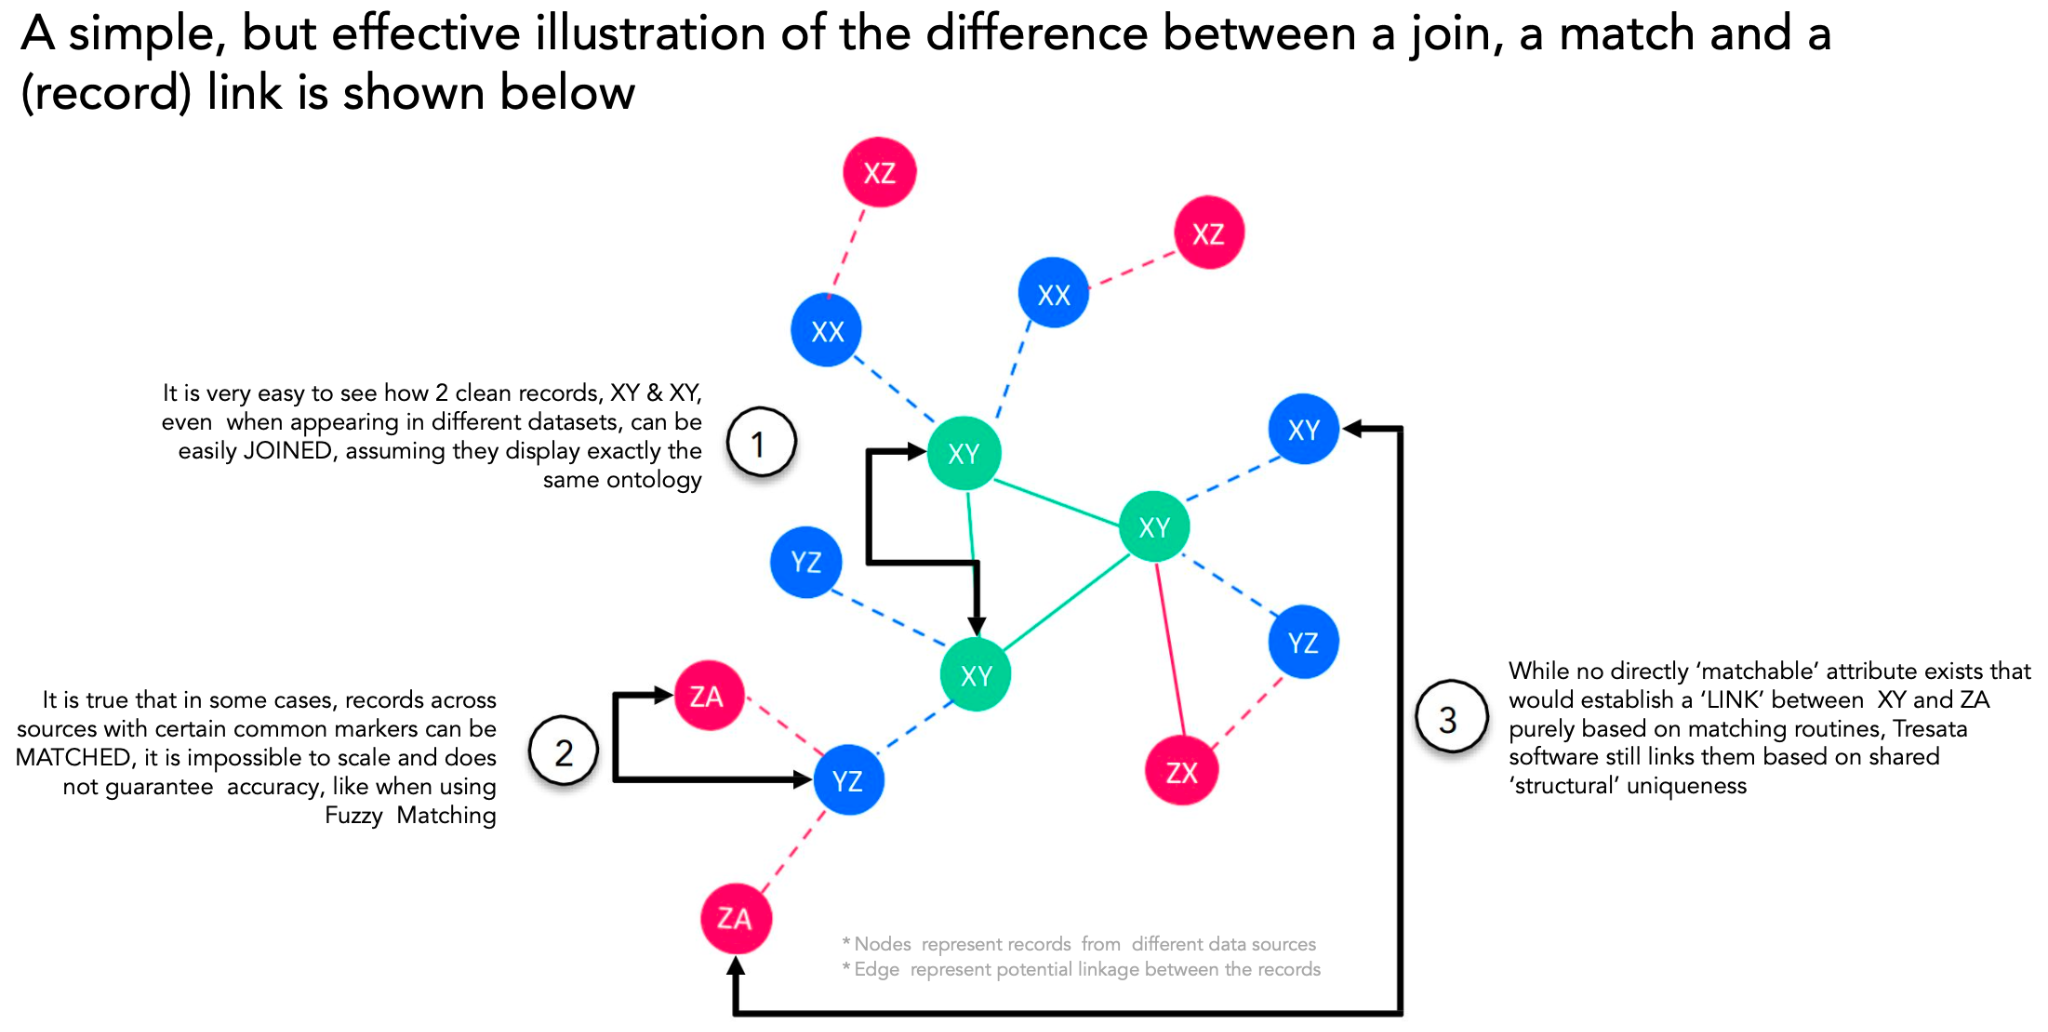
Hopefully you are starting to sense the theme here… implementing the Data Analytics lifecycle is not for the faint of heart (at least using traditional methods)…and now connecting and integrating your data only amplifies that complexity. This step largely involves linking your data together in order to generate a more comprehensive view of your customer, corporation, or product. Often referred to as Entity Resolution, this can be attempted in a number of ways such as joins, matching, or record linkage (as shown in the diagram below). At Tresata, we employ record linkage to probabilistically identify and infer relationships amongst records that represent the associated entity. This inference is made possible by automatically constructing a knowledge graph that enriches the data with context, reinforcing the generated links.
While Record Linkage has traditionally been confined to academia due to its computational intensity, we have enhanced it with the use of AI to operate at a massive scale capable of handling billions and trillions of records. Additionally, once the data linkage is complete, the need for convenient future referencing of your resolved records arises – this is where Tresata IDs come into play. These IDs are distinct tokens that can be used to globally identify entities, like customers, enabling seamless retrieval of all related records with a single key. This is critical as disparate customer identifiers across source systems can hinder information access, often resulting in inaccurate decision making due to missing data.
Continuing with our example of understanding customer purchasing behavior, the next step involves linking the three tables together to create complete customer profiles. Constructing individual rules/ models for each field and table to facilitate matching can be overwhelming, especially with differing field names across sources representing the same information. Using the same canonical configuration DSL we configured in preparation allows users to efficiently refer to multiple fields simultaneously, streamlining the process of linking by mapping diverse source fields to a shared canonical field. Similarly, we have a “pipeline configuration” that allows users to express how they’d like their tables and fields to link together, all using an adjacent DSL and flexible YAML syntax.
To provide a very simple example of how this might look, let’s say for our 3 tables there are three attributes we can connect on for each table, namely: name, address, and email.
Let’s see how this would look using standard SQL:
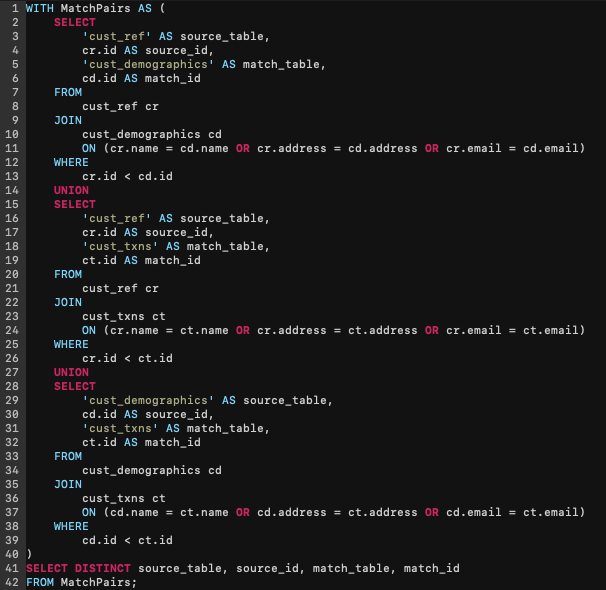
Even in our basic illustration, you can see that achieving this type of linkage demands several join operations, unions, and an intensive distinct operation. It also presupposes that each attribute must be an exact match and that any single attribute can sufficiently establish a connection, which inevitably leads to erroneous pairings. In practical terms, the algorithmic complexity of this exercise grows exponentially with traditional rules-based approaches as you add data sources and combinations for matching. Adding tables (n) and fields (m) for connections increases comparisons by O(n²m), as each table is matched with every other table, and potential matches are evaluated linearly with attributes. To compound matters, managing the rules needed for these numerous comparisons becomes an intimidating task, as any logic updates have cascading repercussions.
To address this challenge, we’ve fine-tuned our software to intelligently assess the configured fields, enabling support for extensive scale and intricate logic. Our approach streamlines the comparison process by identifying unnecessary comparisons while still converging, leading to a reliable and stable outcome. Thus, we are able to harness more advanced matching algorithms that adeptly handle diverse data types, varying formats, naming conventions, token values, and more, all while maintaining user-friendly simplicity.
To demonstrate this, we’ve configured tresata software to perform the same linkage as the SQL example above:
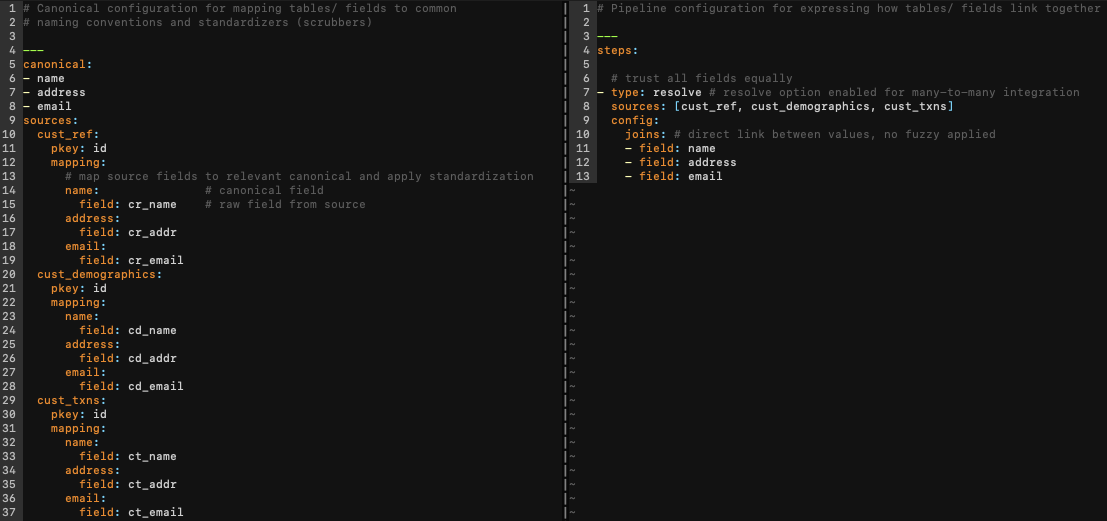
On the left, we have our canonical configuration again for mapping our tables/ fields and on the right we have our pipeline configuration for expressing how to link the tables together. With the configurations above, we can easily connect our three tables with minimal effort in a much more readable and user-friendly fashion. In this instance, all attributes are regarded with equal weight, and no data cleaning or standardization is employed. We know that the real world is replete with data complexities, and relying solely on exact matches seldom furnishes the desired outcome, not to mention a trustworthy solution when attempting matches based solely on attributes like names or addresses (for instance, “John Doe” and “123 Main Street”).
Amending the aforementioned SQL logic to incorporate standardization and more intricate joining conditions would involve substantial effort and time, severely hamper productivity, and is highly error-prone. Conversely, our software streamlines this process. In a matter of minutes, you can articulate a more robust resolution strategy and deploy readily available data cleaners and matching algorithms to augment the quality of your results (as demonstrated below):
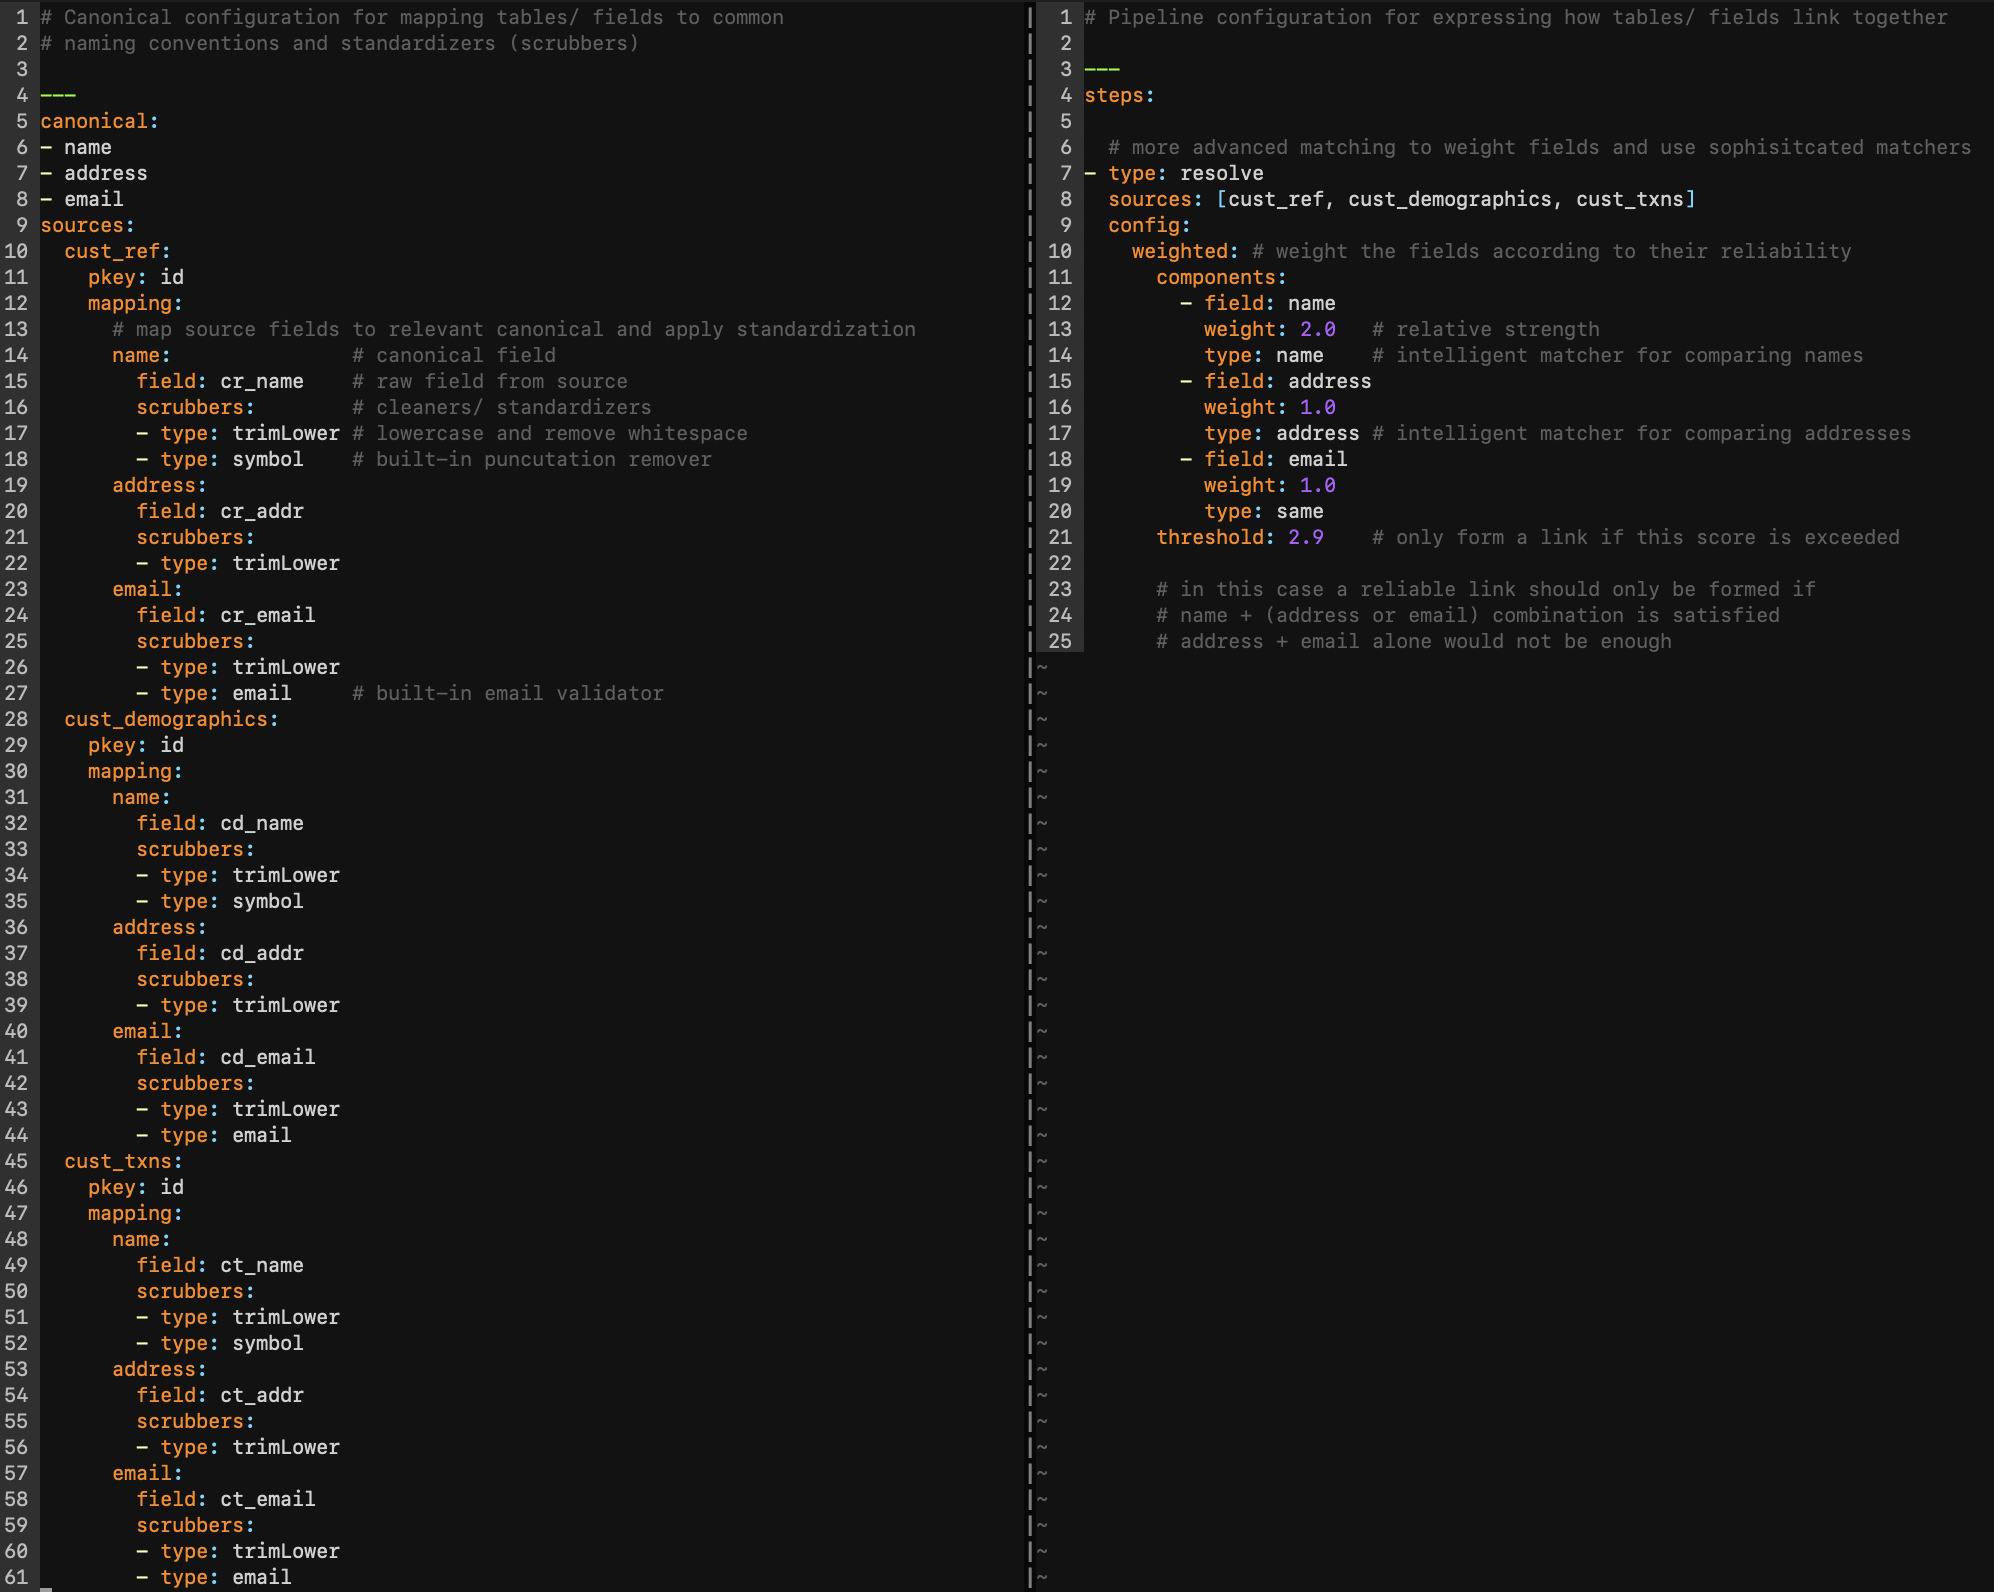
Now we’re talking! With some simple adjustments to our YAML configurations, we’ve integrated built-in standardization algos to enhance the quality of our source data (displayed on the left). On the right, we’ve formulated a more resilient matching strategy that cleverly establishes connections solely when there’s a match in name plus either address or email fields among the records. This approach yields a heightened level of accuracy and resolution precision resulting in superior outcomes.
Step 5 – Validate your Results
Now you have concrete outputs to review and validate against your expectations. The key lies in analyzing result accuracy based on your intended goals. For example, if you’re aiming to determine the number of unique customers, validating records within a Tresata ID for congruence is crucial. To help with that, we’ve compiled a number of statistical heuristics we’ve employed overtime to expedite this process that largely fall under two classifications:
- Under-compression – when two records that should be linked didn’t connect
-
• Examples: calculate how many Tresata IDs share a common identifier i.e. Tax ID… if more than 1 Tresata IDs share the same Tax ID it’s plausible that they are actually the same and should share a TID.
-
- Over-compression – when two records that shouldn’t be linked came together
-
• Example: calculate how many Tresata IDs have more than one Tax ID… if a Tresata ID has more than 1 Tax ID it’s plausible that it combined two records that should be different.
-
- Note: It’s important to mention that these statistics, while incredibly helpful, aren’t enough just on their own. For instance, data quality can influence the results to look worse than they actually are i.e. if variations of the same TaxID 00123 and 123 look different, but are actually the same and would flag in our over-compression scenario above. As such, these should be used as guides to direct your validation efforts.
Additionally, we recommend (at a minimum) reviewing your top 50-100 biggest clusters (Tresata IDs) as it can help with identifying any potential hairballs (aka overly connected entities) and reveal if there may be a more pervasive issue to resolve. We’ve also found tremendous benefit in using a network for interrogating results, particularly when it comes to debugging a cluster of records (see visual below):
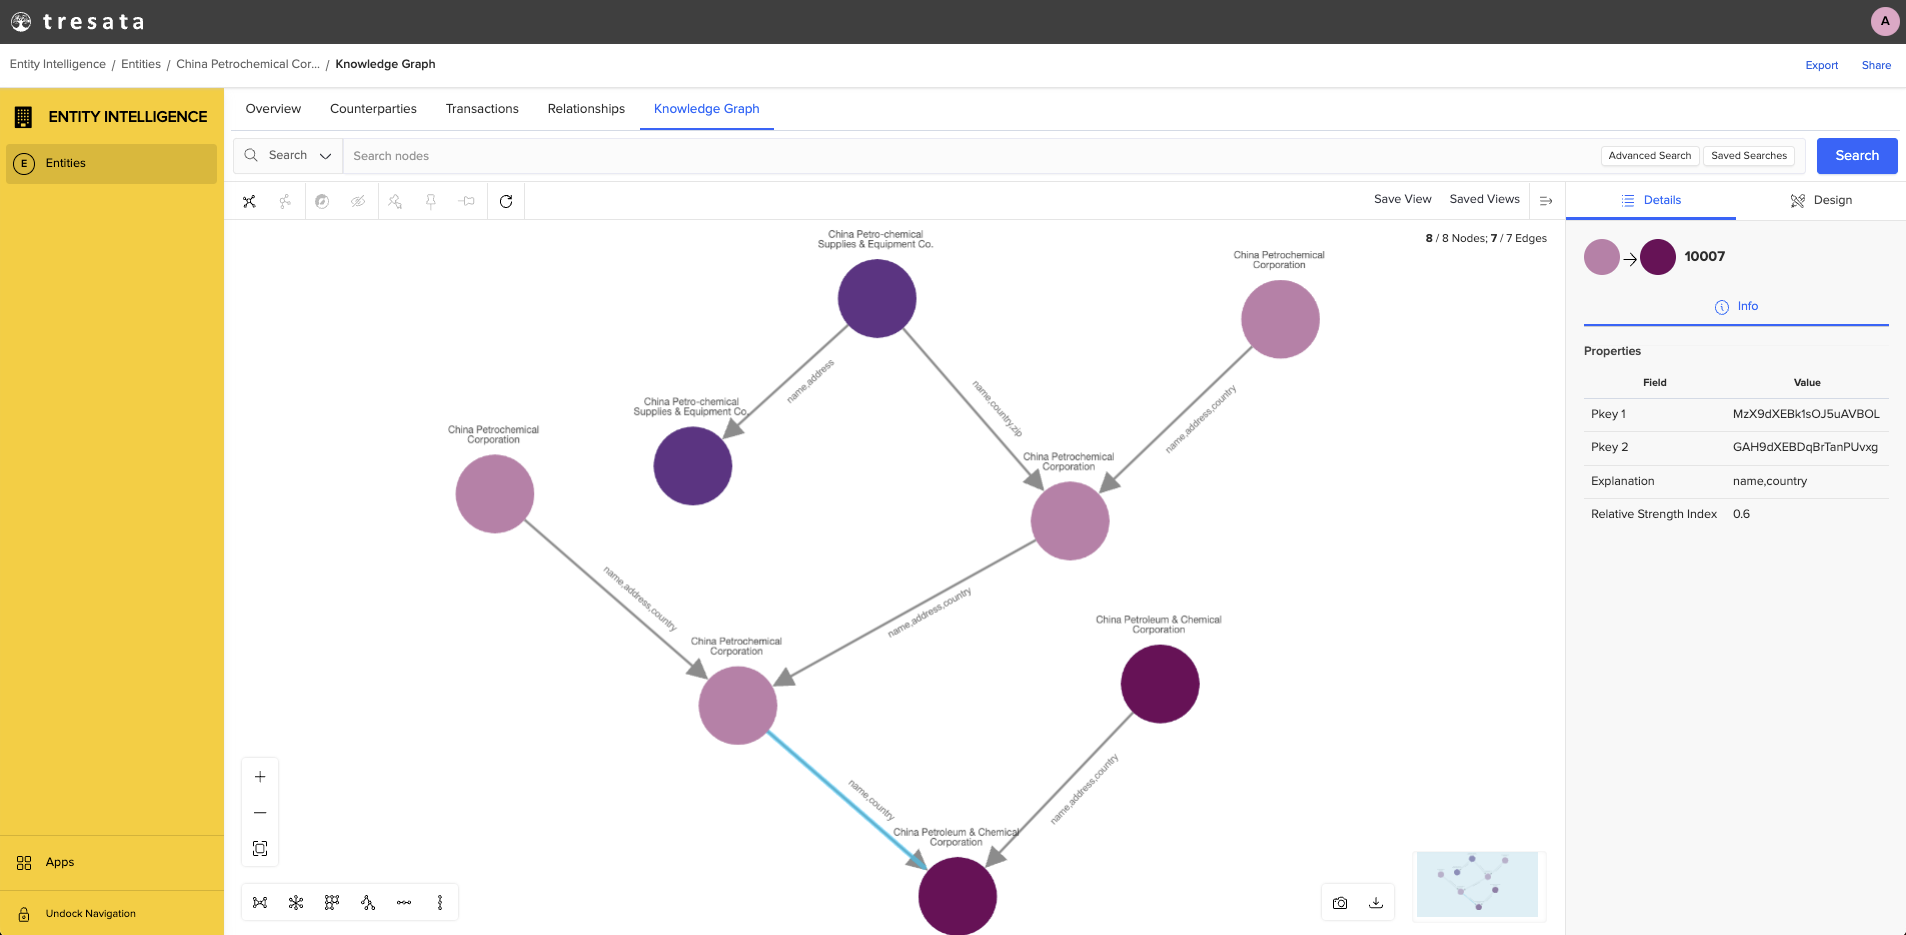
Looking at records in a nodes and edges relationship graph can be incredibly revealing especially as it is usually only a few records causing your problems. In the example above, you can see that the light pink and maroon nodes at the bottom are only connected via a name, country, which is a weaker link than the other edges above signaling something to potentially investigate. Uncovering a situation like this in tabular form, while possible, would likely require a lot more analysis and effort to be expended. Lastly, keep in mind this is an iterative process, so be patient and thorough with your review to maximize your end result.
Step 6 – Enrich your Data
Now that you’ve confirmed the validity of your results and are confident in your newly developed data product, the next step is to enhance and refine the output to further improve its quality. Consider data linking as the process of gathering all pertinent data into a Tresata ID, while enrichment adds the final touches. For instance, the information you seek might be spread across different records – one record has a name, another an address, and a third an email. To utilize this information collectively (without accessing each record individually), a method for unifying these distinct pieces is essential.
At Tresata, we’ve created a flexible DSL that empowers you to specify how this information should be curated. This is again where those canonical fields come into play, providing a consistent means of applying enrichment across tables. You can choose to curate the values based on frequency, recency, priority from a trusted data source, a combination of these three, or any specialized expressions based on preference.
To do this with Spark/ Scala is computationally expensive and requires performing a series of costly aggregations within each Tresata ID for every table to produce the desired result (see below):
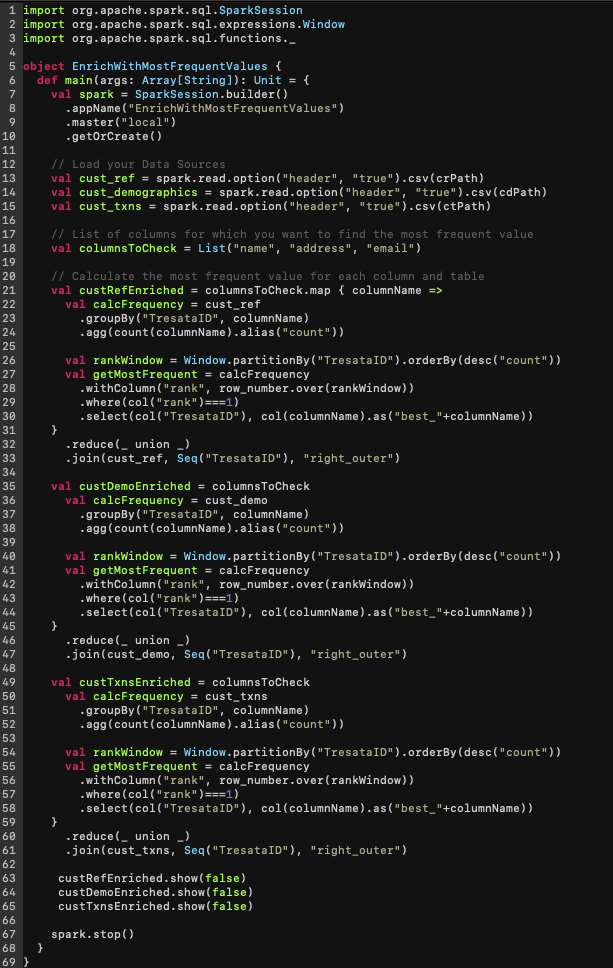
Not only does it require significantly more lines of code, but it also introduces variance yet again in how each individual might approach the problem.
Now, let’s take a look below at how we might perform this enrichment for name, email, and address using Tresata software and enhance it so that email is chosen by recency and address is a combination of recency and priority based on a preferred data source:
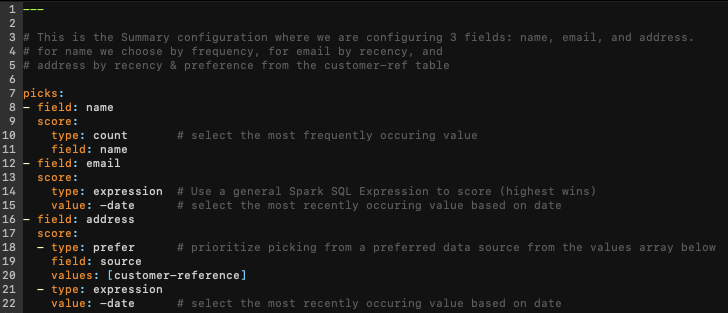
As you’ll notice, to perform the same enrichment (with some additions) requires a fraction of the coding and is significantly easier to read and update than the previous method.
Lastly, once you’ve enriched your records, you will likely need to harmonize the output schema to fit your downstream applications. This could take the form of a single unified schema to access all your data in a single view or perhaps a targeted approach where each table is organized individually. Though simple in theory, it’s actually more intensive than it sounds. To streamline the process, we have a simple DSL that allows you to configure what fields you want to see across all tables or go table specific:
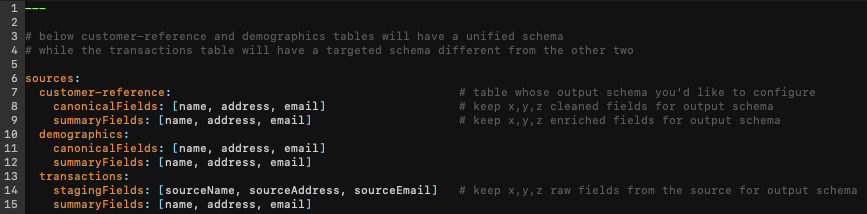
Achieving this using traditional approaches would involve performing a sequence of renaming actions and possibly unions for every desired table and field. This process is both cumbersome and inefficient, consuming valuable time.
Step 7 – Orchestrate your Data
Although each individual step above holds significance independent from the others, their true value emerges when you can automate and repeat them multiple times over…that’s where Orchestration comes into play.
At this phase, you’ve successfully created your data product and now aim to maintain its freshness periodically, eliminating the need to manually trigger each step for every update. This typically involves setting up workflows to configure dependencies, retry mechanisms, and concurrency using tools like Airflow, Dagster, or Argo to ensure seamless step synchronization. While each tool offers its merits, we’ve opted for Argo due to its integration with Kubernetes (K8s). Kubernetes serves as a container orchestration platform that simplifies resource coordination for containerized applications. Notably, it features auto-scaling to meet resource demands, a crucial aspect considering the varied computational needs of the preceding steps. This resource optimization aligns with workload demands, leading to substantial cost savings.
In essence, the key to this step is orchestrating each process to optimize engineering productivity, minimize effort, and ensure cost-effectiveness and we’ve found Kubernetes instrumental in achieving this objective.
Summary
While multiple approaches exist for accomplishing the steps outlined above, the freedom and efficiency derived from utilizing Tresata’s software can be truly transformative. Having proven this in our first decade as a company with hundreds of companies around the world, we are incredibly excited to be broadening its reach as a self-serve SaaS product for anyone facing these challenges today.
With Tresata’s AI-powered software, our clients (and their data engineering teams) have been enabled to focus on higher value-added tasks versus grappling with the tedium and monotony of traditional data management. They’ve reaped the benefits of efficiency gains, reusability, speed to insights, and overall effectiveness for data and analytics initiatives the world over. Now, you can too.
We’re on a mission to enable the world to understand and use its data – and ultimately democratize the power of AI. We invite you to join us in this mission and look forward to learning from you as well.